At a glance
- In 2022–23, Queensland residents had 2,894,757 admitted patient episodes, for a standardized rate of 490.5 per 1,000 persons, with higher rates among females than males.
- In 2022–23, standardised hospitalisation rates were 25.5% higher in remote areas compared to major cities, and 18.9% higher in the most disadvantaged compared to the most advantaged areas.
- In the past two decades from 2002–03 to 2022–23, standardised hospitalisation rates increased 51.5% (from 350.8 to 490.5 per 1,000 persons).
All cause hospitalisations
In 2022–23,
- There were 2,894,757 admitted patient episodes of care in Queensland acute public and private hospitals for Queensland residents—53.2% were for females.
- The age-standardised rate (ASR also referred to as standardised rates) was 490.5 per 1,000 for persons (522.1 for females and 461.1 for males).1
Trends
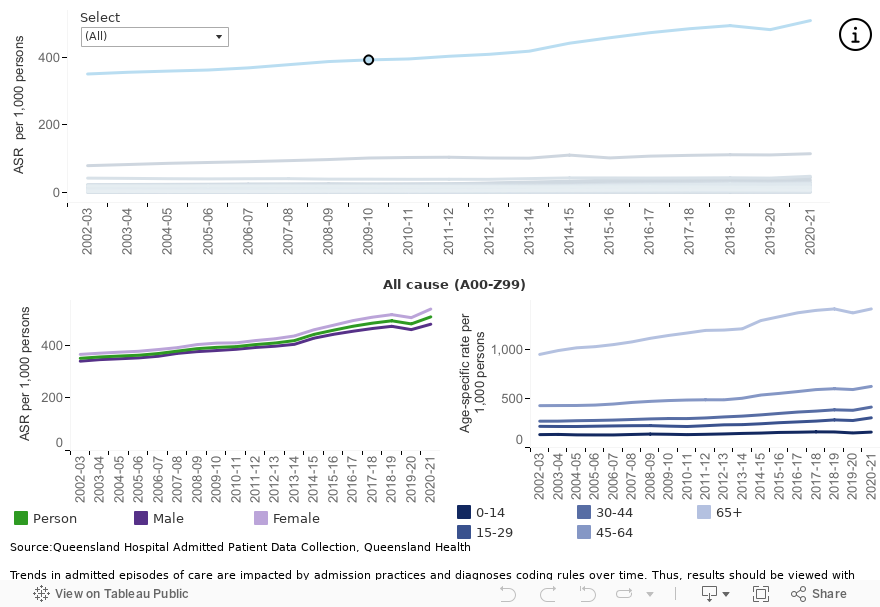
Standardised hospitalisation rates increased from 350.8 per 1,000 persons in 2002–03 to 490.5 per 1,000 persons in 2022–23 (Figure 1).
COVID-19 and related changes in admission practice, and other public safety measures, varied hospitalisation patterns with additional data needed to determine whether longer-term trends are affected.
From 2002–03 to 2022–23, standardised hospitalisation rates increased 51.5%. There was no evidence that the 45.7% increase in males and the 54.5% increase in females differed. Over this period, standardised hospitalisation rates increased in all age groups but more so in older age groups:
- Increases were 44.7% in those 65 and older, 39.3% in 45 to 64 year olds and 46.4% in 30 to 44 year olds.
- Those 15 to 24 years and 14 years and younger increased by 29.7% and 32.8%, respectively.
Figure 1: Queensland trends in all cause hospitalisation rates
Broad causes of hospitalisations
Admitted patient episodes of care are coded using the International Statistical Classification of Diseases and Related Health Problems, Tenth Revision, Australian Modification (ICD-10-AM).2
ICD codes divide diseases and health conditions into similar categories (ICD chapters) based on the type of disease, the body systems affected, or the circumstances that caused the condition. While changes to ICD coding over time affects the interpretability of the results, understanding admission patterns by ICD chapters provides insights into the broad reasons people are hospitalised.
Based on standardised rates of principal diagnosis among admitted Queensland residents in 2022–23:
- The most common principal diagnosis in males and females was Factors influencing health status and contact with health services, which includes admissions for routine therapy such as dialysis and chemotherapy (Figure 2). Repeated hospital admissions for routine therapy are often required for chronic conditions which, in part, contributes to high admission rates.
- Adults 65 years and older have the highest age-specific rate for these types of admissions, as well as most admissions included in other ICD chapters. Exceptions include those related to childbirth, congenital abnormalities or mental health (Figure 3).
Figure 2: Queensland hospital admission rates by ICD chapter, 2022–23
Trends
Trends in admitted episodes of care are presented below, however, changes in hospital admission practices and diagnoses coding rules over time mean that some results should be viewed with caution.3–7
Changes in standardised rates for admitted episodes of care from 2002–03 to 2022–23 include:
- Factors influencing health status and contact with health services increased by 45.1% with standardised rates increasing from 80.1 to 116.2 per 1,000 persons, noting that there was a decrease in 2022–23.
- Similarly, Symptoms, signs and abnormal findings increased almost 2-fold from 20.0 to 38.6 per 1,000 persons.
- Mental and behavioural disorders decreased from the pandemic high observed in 2020–21. Standardised rates are now below pre-pandemic rates for most age groups, countering the previous steady increase from 2007–08. While rates remain high for those 65 years and older, it is important to note that dementia and related conditions are included in this ICD chapter.
- Changes in hospital admission practice during the COVID-19 pandemic and lower numbers of influenza and other respiratory infections were key factors in driving a temporary decline in Diseases of respiratory system from 2018–19 to 2020–21. Rates in 2022–23 have returned to pre-pandemic rates.
Figure 3: Queensland trends in hospital admission rates by ICD chapter
If dashboard does not load, view the dashboard in Tableau
Remoteness and socioeconomic differences
Differences in standardised hospitalisation rates between geographic areas are complex and are impacted by multiple factors such as differences in:
- underlying patterns of disease and injury
- the number of hospitalisations needed to treat health conditions
- the availability and accessibility of healthcare locally.
Results should be interpreted as broad patterns that may indicate a need for further analysis. Such analyses, including adjusting for repeated admissions for a single person, would provide better insights for specific conditions.
In 2022–23, people living in remote and very remote areas or in more disadvantaged areas of Queensland had higher hospitalisation rates (Figure 4).
- Standardised rates in remote and very remote areas were 25.5% higher than in major cities (613.8 and 489.0 per 1,000 persons, respectively).
- Hospitalisation rates were 18.9% higher in the most disadvantaged areas compared to the most advantaged areas (556.0 and 467.5 per 1,000 persons, respectively).
- Remote and very remote areas had higher standardised hospitalisation rates than major cities for Factors influencing health status and contact with health services (86.0% higher), Injury poisoning and other external causes (65.9% higher), circulatory conditions (33.5% higher) and respiratory conditions (58.7% higher).
- Similarly, Queenslanders living in the most disadvantaged areas had the highest standardised hospitalisation rates for Factors influencing health status and contact with health services (48.6% higher), Injury poisoning and other external causes (47.2% higher), circulatory conditions (30.0% higher), and respiratory conditions (61.1% higher).
Conversely, Mental and behavioural disorders showed the opposite pattern with standardised rates in major cities twice as high as in remote and very remote areas and standardised rates in the most advantaged areas 74.1% higher than in the most disadvantaged areas. Under the ICD coding system, the Mental and behavioural disorders includes dementia and Alzheimer’s disease which should be considered in interpreting these results.
Figure 4: Hospitalisation rates by remoteness and socioeconomic status for all cause and selected ICD-10-AM chapters, 2022–23
Additional information
Data and statistics
More information about Queensland hospitalisations is available from the Queensland Health performance website and Statistical Services Branch website.
National health statistics are available on the AIHW Admitted patients and Australia’s hospital at a glance website.
Section technical notes
- The ICD coding system is maintained by the World Health Organization (WHO) and provides internationally comparable mortality and morbidity statistics over time and between regions. In Australia, the ICD-10 were adapted for the Australian context from the WHO ICD system. The ICD-10-AM is now maintained by the Independent Health and Aged Care Pricing Authority (IHACPA).5 Throughout this report ICD-10 categorisation is based on ICD-10-AM.
- Multiple factors may cause a person’s hospital admission. The principal diagnosis is the one deemed chiefly responsible for the admission.
- Data reported in this section were sourced from the Queensland Hospital Admitted Patient Data Collection (QHAPDC). Individual records in the QHAPDC are episode-based, meaning that multiple episodes from a same person will be counted multiple times in a reporting period.
- Separations from interstate residents, public psychiatric hospitals, and those flagged as unqualified newborns, organ donors or boarders are excluded.
- Unless otherwise stated, age-standardised rates were calculated by standardising to 2001 Australian standard population.
- See the About this Report section of this report for trend analysis methods. In text, results are presented as the total increase or decrease over the specified time period. In graph hover boxes, the annual percentage change (APC) and 95% confidence intervals are presented. The APC is the average change per year over the time period.
Figures on this page are interactive
To learn more about how to navigate interactive figures, dashboards, and visualisations, see About this Report.
References
- Queensland Health. 2024. Queensland Hospital Admitted Patient Data Collection (QHAPDC), https://www.health.qld.gov.au/hsu/collections/qhapdc, accessed 14 May 2024.
- Independent Health and Aged Care Pricing Authority. 2022. ICD-10-AM/ACHI/ACS, https://www.ihacpa.gov.au/health-care/classification/icd-10-amachiacs, accessed 28 May 2024.
- Queensland Health. 2011. Changes in diabetes coding from the fifth to the sixth and seventh editions of ICD-10-AM, https://www.health.qld.gov.au/__data/assets/pdf_file/0021/364530/techreport_8.pdf [PDF 140 KB], accessed 30 January 2023.
- Queensland Health. 2015. Recent growth in public hospital separations – more than meets the eye?,
https://www.health.qld.gov.au/__data/assets/pdf_file/0017/144710/statbite68.pdf [PDF 107 KB], accessed 4 November 2022. - Queensland Health. 2018. Impact of changes to coding palliative care,
https://www.health.qld.gov.au/__data/assets/pdf_file/0037/692956/techreport-18.pdf, [PDF 104 KB], accessed 4 November 2022. - Queensland Health. 2011. Impact of changes in diabetes coding on Queensland hospital principal diagnosis morbidity data, https://www.health.qld.gov.au/hsu/tech_report/techreport_9.pdf [PDF 117 KB], accessed 11 November 2022.
- Queensland Health. 2018. Rehabilitation episodes of care: Top 10 principal diagnosis codes 2014/2015 to 2016/2017,
https://www.health.qld.gov.au/__data/assets/pdf_file/0021/693102/statbite76.pdf [PDF 111 KB], accessed 4 November 2022.